Atiaf Al-Muqri

Data Analyst | محللة بيانات

Data Cleaning + Statistical Analysis + Insights

I turn data into clear information that helps explain a problem and support decisions — through cleaning, statistical analysis, and dashboards in Power BI and Excel.

أحوّل البيانات إلى معلومات تساعد في فهم المشكلات واتخاذ القرارات.

About

I'm a data analyst. My work covers cleaning and processing data, exploratory and statistical analysis, and building dashboards in Power BI and Excel that bring out the indicators behind a problem.

I've also applied the same care for data quality to AI-related work: on the Arabic Post-Training Data Factory, I contributed to reviewing dataset quality and evaluating the metrics used to assess it. Across all of it, the goal is the same — turning data into information people can use to understand a problem and decide.

محللة بيانات مهتمة بتحليل البيانات والتحليل الإحصائي وتنظيف البيانات واستخراج المؤشرات والرؤى، وأسعى إلى تحويل البيانات إلى معلومات تساعد في فهم المشكلات واتخاذ القرارات.

  • Data Cleaning
  • Statistical Analysis
  • Data Visualization
  • Power BI
  • Excel
  • Python

Skills

Data Analytics

  • Data Cleaning
  • Exploratory Data Analysis (EDA)
  • Statistical Analysis
  • Data Visualization
  • Data Quality
  • Data Processing

Tools & Technologies

  • Python
  • Power BI
  • Microsoft Excel
  • Google Colab

AI & Data

  • Large Language Models (LLMs)
  • AI-assisted Data Processing
  • SFT & DPO Dataset Preparation
  • Arabic Dataset Preparation

Projects

Power BI Projects

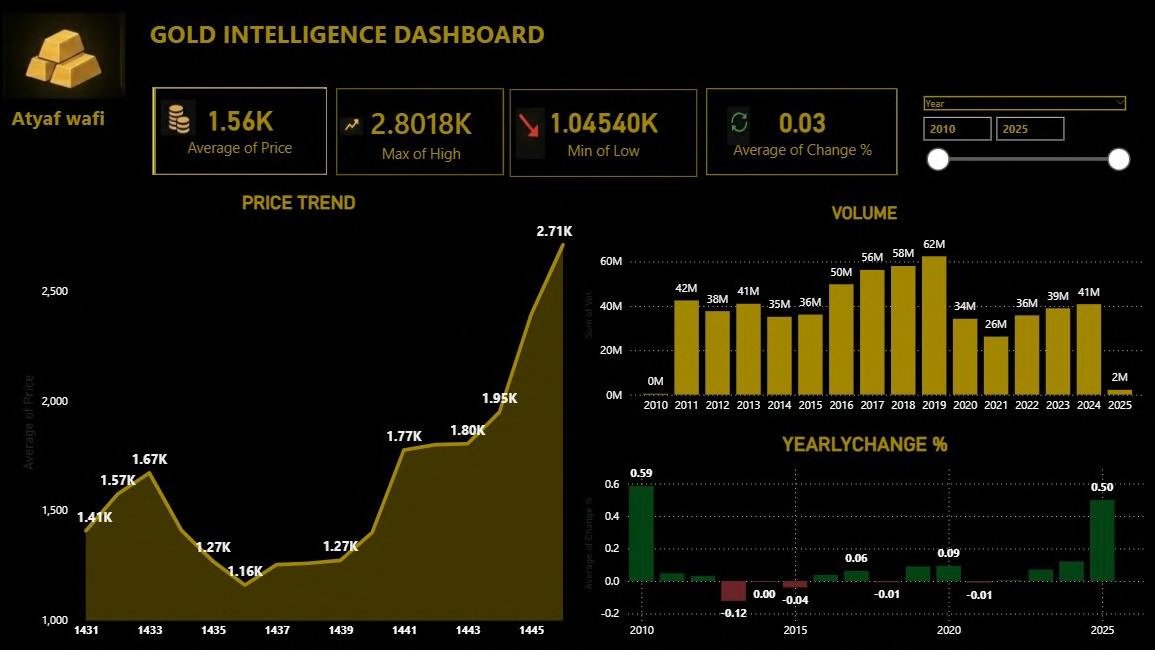
Gold Analysis dashboard in Power BI showing price trend, volume, and yearly change.
Main dashboard
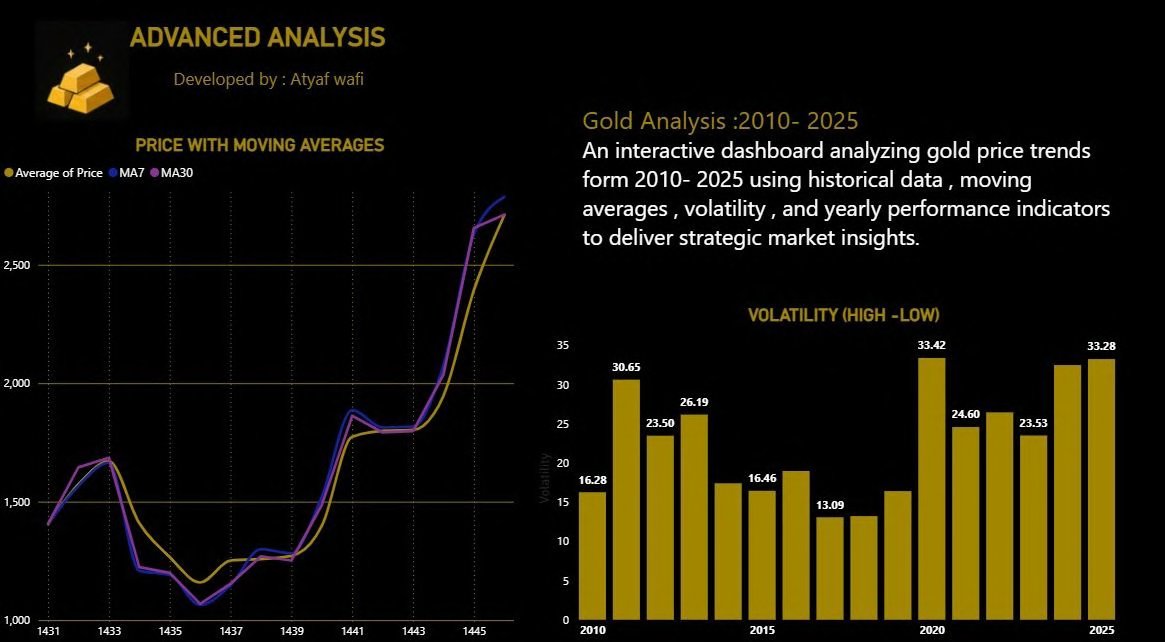
Advanced gold price analysis with moving averages and volatility chart.
Advanced analysis — moving averages and volatility

Power BI · Data Analytics

Gold Analysis

Gold Intelligence Dashboard

Interactive Power BI analysis of gold price trends, trading volume and volatility, 2010–2025.

  • Power BI
Project details
Problem
Understand gold price behavior and volatility from 2010 to 2025.
Data
Historical gold prices — average, high/low, trading volume, moving averages (MA7, MA30).
Analysis
Trend lines, yearly change %, moving averages, and a volatility (high–low) measure.
Dashboard
Interactive Power BI report with a year slicer, price trend, volume, and an advanced analysis page.
Tools
Power BI
My Role
Individual project — built end-to-end.
Key Insights
Strong price growth toward 2025, lowest levels in the early years, high trading volume in Mar–May (~61M), and moving averages showing aligned short- and long-term upward momentum.
Outcome
Highlights the long-term price trend, trading-volume patterns, and periods of volatility.
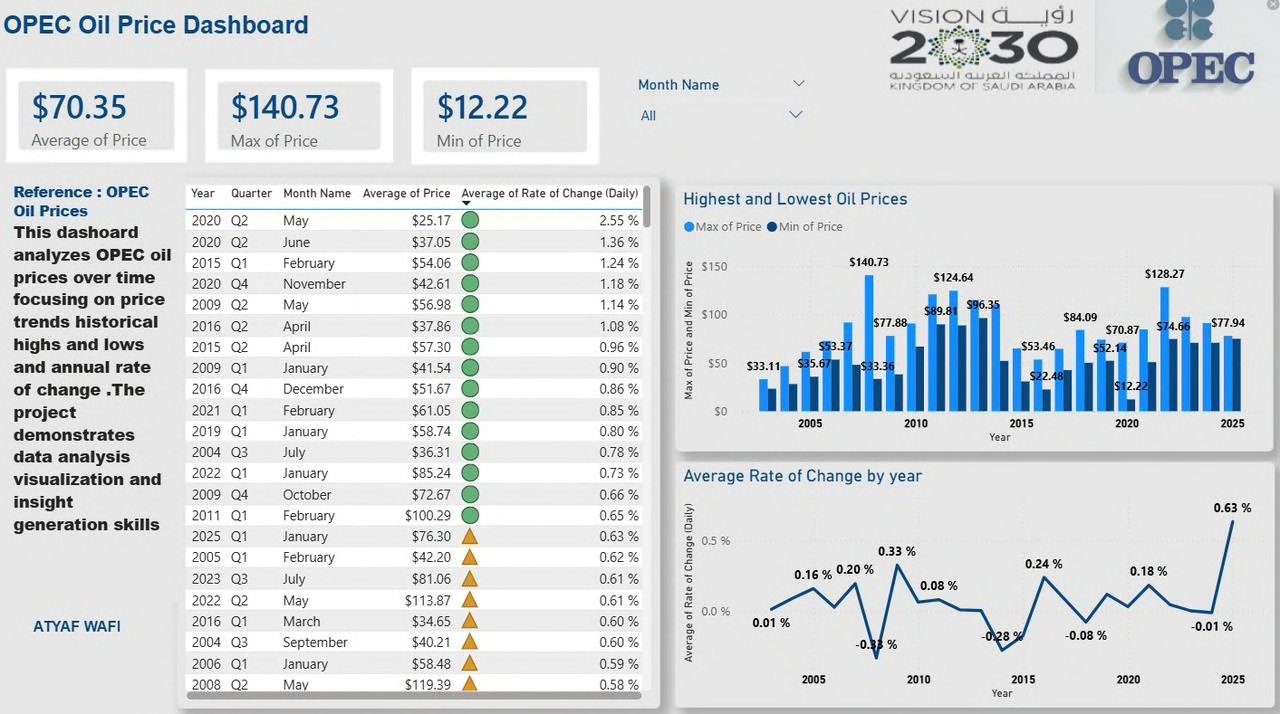
OPEC oil price dashboard in Power BI showing historical highs and lows.
Price dashboard

Power BI · Data Analytics

OPEC Analysis

OPEC Oil Price Dashboard

Power BI dashboard tracking OPEC oil price highs, lows and rate of change over time.

  • Power BI
Project details
Problem
Analyze OPEC oil price trends, historical highs and lows, and annual volatility.
Data
Monthly oil prices (2004–2025) and daily rate of change.
Analysis
KPI cards for average/max/min price, a highest-and-lowest comparison chart, and average rate of change by year.
Dashboard
Power BI report with month and year filters.
Tools
Power BI
My Role
Individual project — built end-to-end.
Key Insights
Clear long-term price trends with significant market fluctuations; distinct peaks and drops.
Outcome
Highlights price peaks and drops and the year-to-year rate of change.
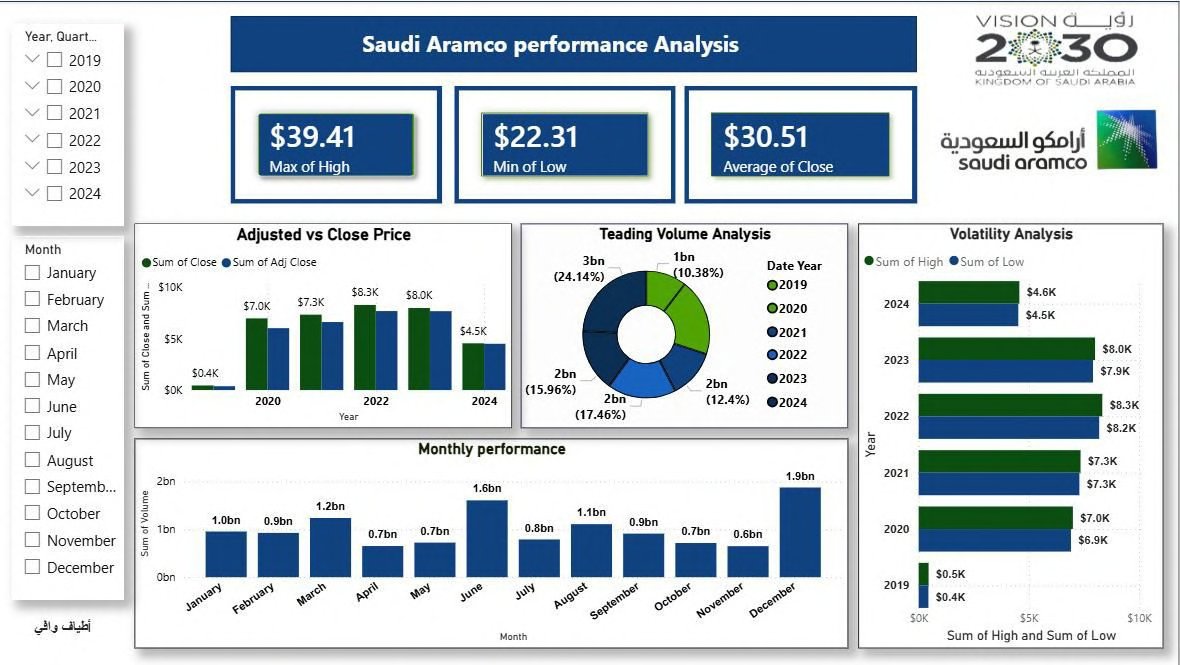
Saudi Aramco performance analysis dashboard in Power BI.
Performance dashboard

Power BI · Data Analytics

Aramco Analysis

Saudi Aramco Performance Analysis

Power BI analysis of Saudi Aramco's stock price, trading volume and volatility, 2019–2024.

  • Power BI
Project details
Problem
Track Saudi Aramco's stock performance and volatility over time.
Data
High, low, and close prices plus trading volume by year (2019–2024) and month.
Analysis
Max/min/average close price, adjusted-vs-close comparison, volume distribution by year, and yearly volatility bands.
Dashboard
Power BI report with year and month slicers, KPI cards, and volatility visuals.
Tools
Power BI
My Role
Individual project — built end-to-end.
Key Insights
Peak near $39.41 and a low near $22.31, with noticeable yearly fluctuation inside a stable long-term trend.
Outcome
Highlights the price range, yearly fluctuation, and trading-volume patterns for 2019–2024.
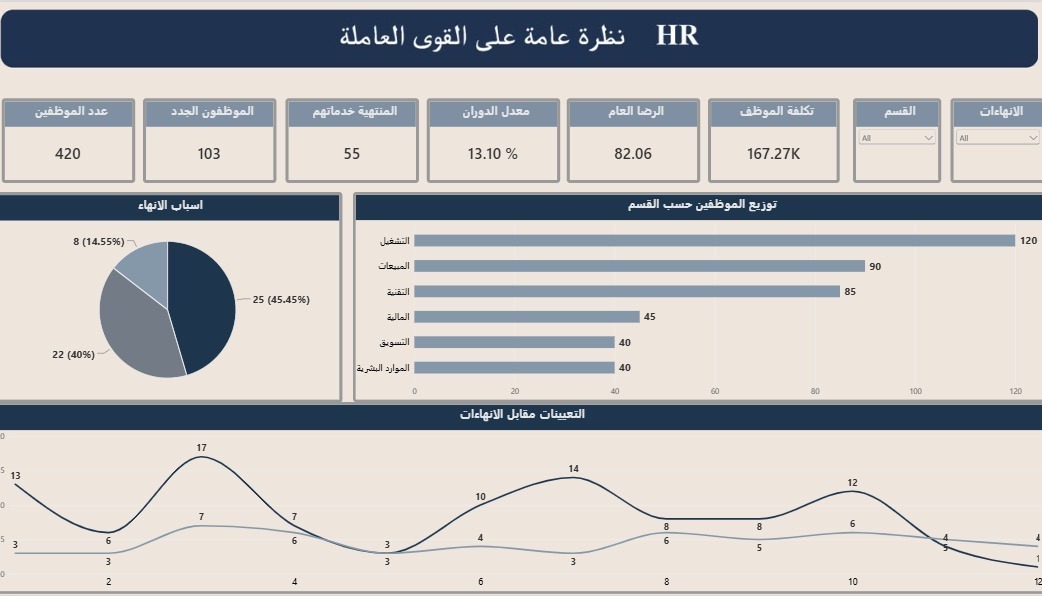
HR workforce overview dashboard showing employee KPIs, turnover reasons, department distribution, and hiring trends.
Workforce overview · نظرة عامة على القوى العاملة
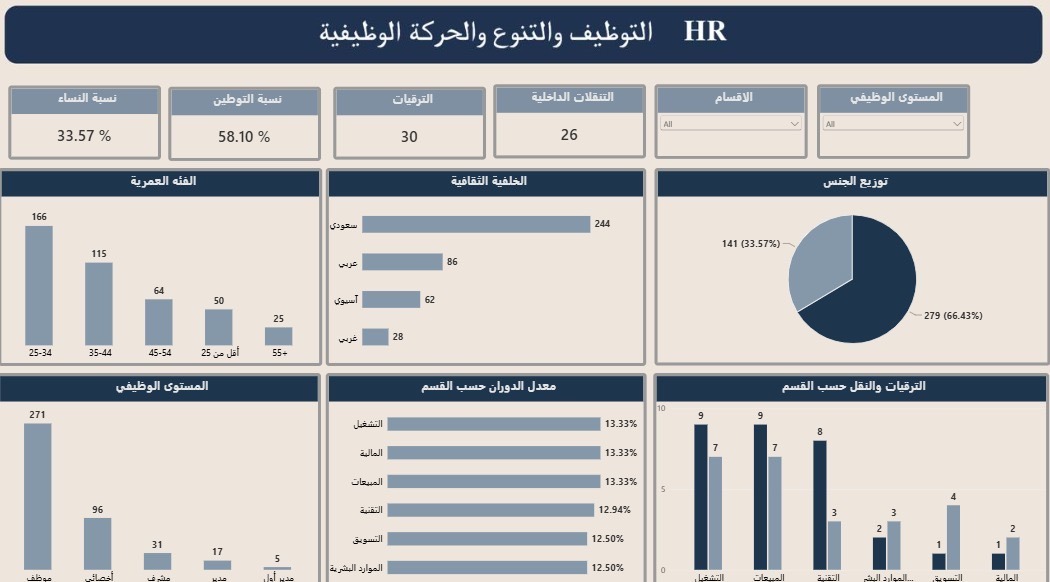
HR recruitment and mobility dashboard showing hiring rate, promotions, internal transfers, gender, age, and nationality distribution.
Recruitment & mobility · التوظيف والتنوع والحركة الوظيفية
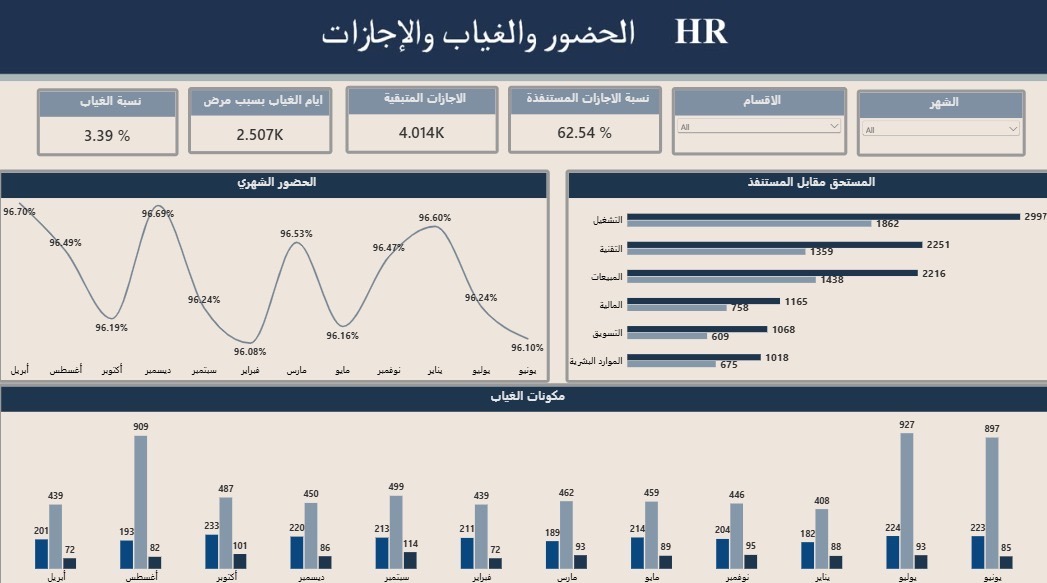
HR attendance and leave dashboard showing attendance rate, absence days, remaining leave, and monthly attendance.
Attendance & leave · الحضور والغياب والإجازات
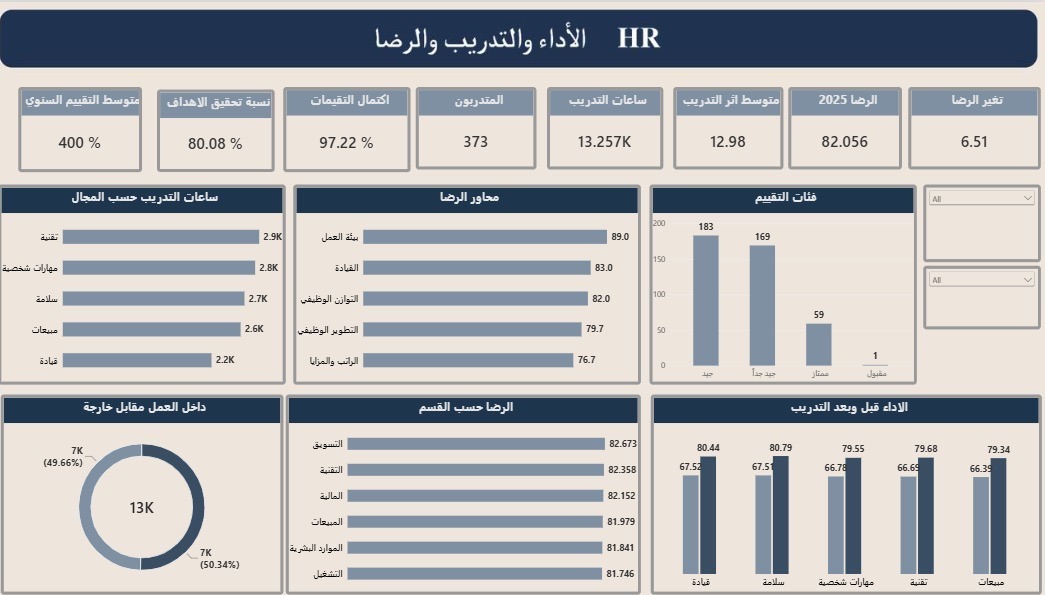
HR performance, training, and satisfaction dashboard showing evaluation, training hours, satisfaction dimensions, and performance before and after training.
Performance & training · الأداء والتدريب والرضا
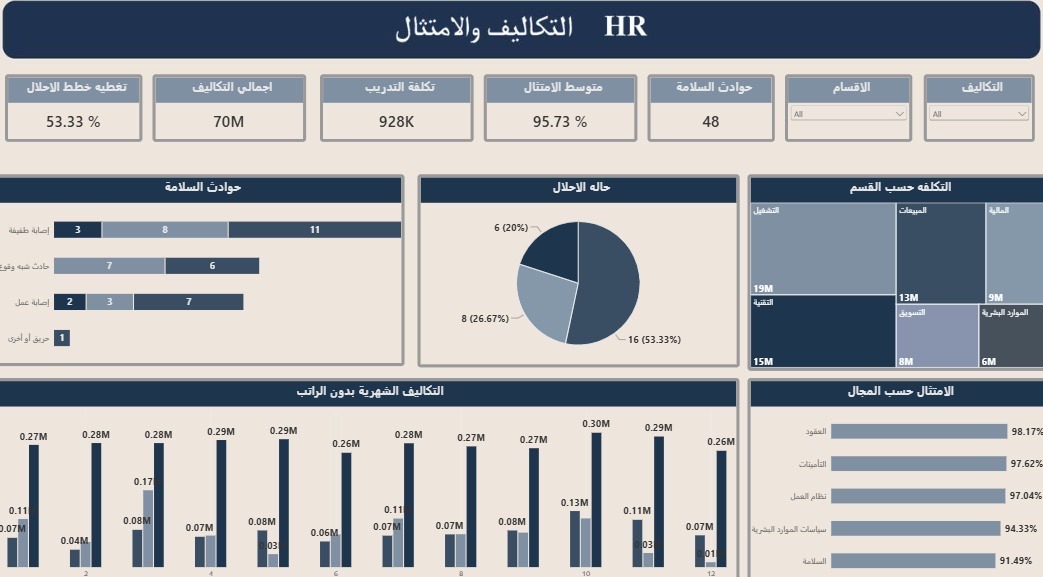
HR costs and compliance dashboard showing total costs, training costs, safety incidents, localization, and compliance by domain.
Costs & compliance · التكاليف والامتثال

Power BI · Data Analytics

HR Analytics Dashboard

تحليل بيانات الموارد البشرية

An interactive human resources dashboard covering workforce overview, recruitment and job mobility, attendance and leave, performance and training, and costs and compliance.

  • Power BI
  • HR Analytics
Project details
Scope
Five dashboard views covering key human resources functions.
Workforce
Employee headcount, new hires, completed services, turnover rate, and department distribution.
Recruitment & Mobility
Recruitment rate, female workforce share, promotions, internal transfers, and employee demographic distribution.
Attendance & Leave
Attendance rate, absence days, remaining leave, leave utilization, and monthly attendance trends.
Performance & Training
Performance evaluations, goal achievement, training hours, training fields, and satisfaction dimensions.
Costs & Compliance
Total costs, training costs, safety incidents, localization, and compliance indicators.
Tools
Power BI

Excel Projects

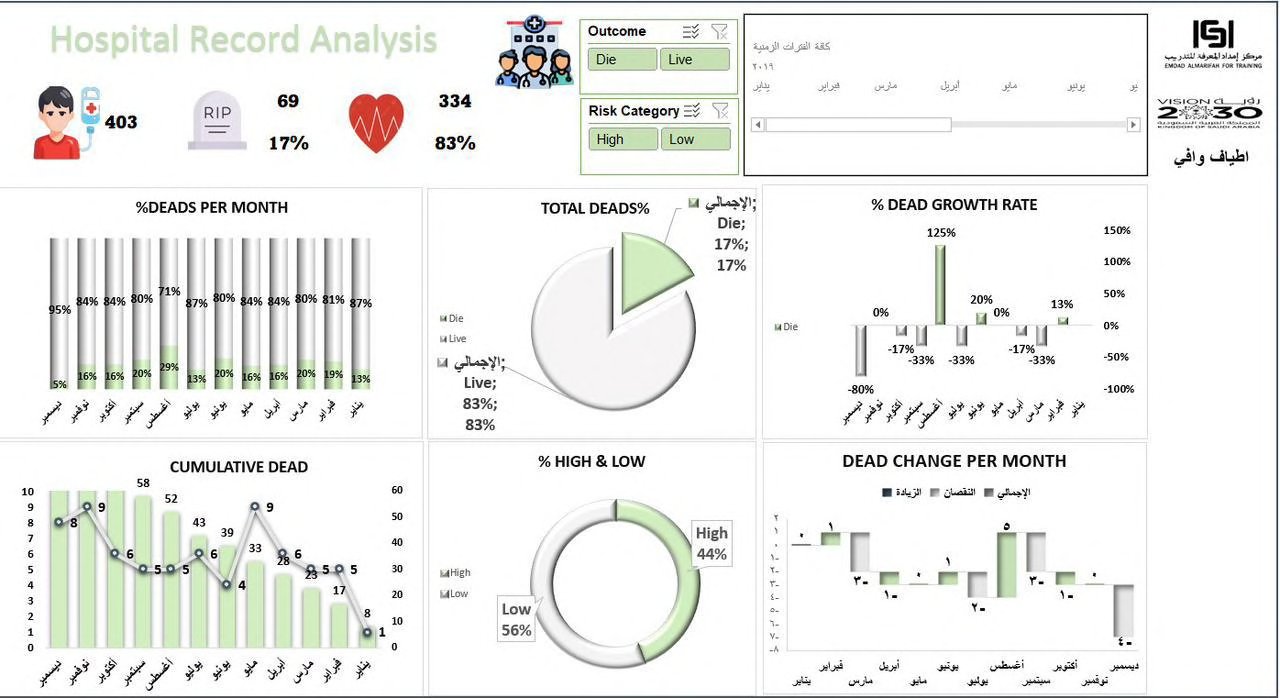
Hospital record analysis dashboard in Excel showing outcomes and risk category.
Analysis dashboard

Excel · Data Analytics

Hospital Analysis

Hospital Record Analysis

Excel workbook that organizes 403 patient records and turns them into a dashboard of outcomes and risk categories.

  • Excel
Project details
Problem
Analyze hospital patient-outcome records to support care and risk decisions.
Data
403 patient records, each with an outcome (Die/Live) and a risk category (High/Low).
Analysis
Mortality rate of 17% (69 of 403) against 83% survival (334), a 44%/56% High/Low risk split, and monthly death-rate and cumulative trends.
Dashboard
Excel dashboard with Outcome and Risk Category slicers, KPI cards, and monthly trend charts.
Tools
Excel
My Role
Individual project — built end-to-end.
Key Insights
Clear variation in outcomes and mortality across months, with an identifiable risk distribution.
Outcome
Highlights outcome rates, the risk distribution, and month-to-month changes in mortality.
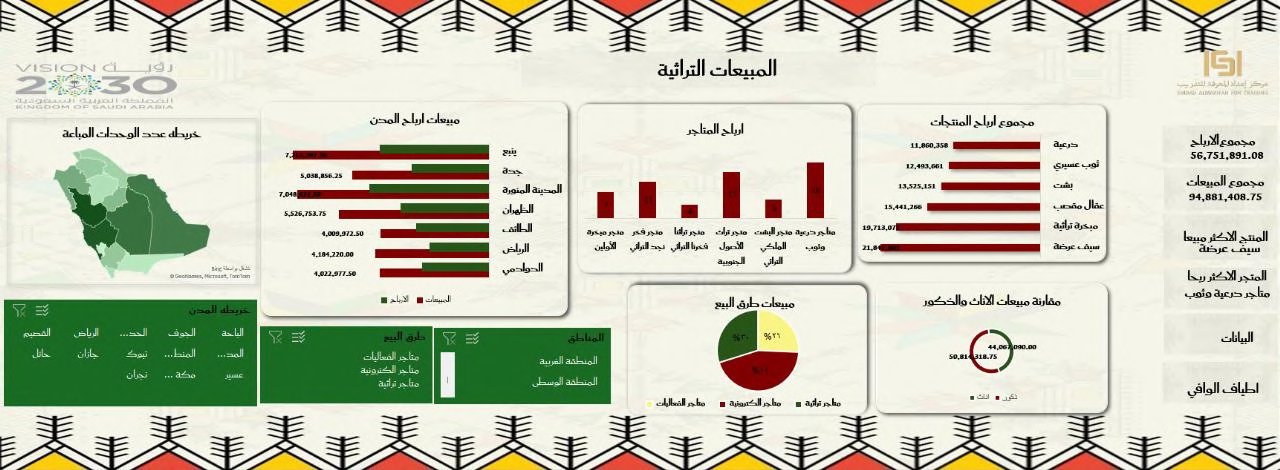
Heritage products sales dashboard in Excel showing revenue by city, store, and product.
Sales dashboard

Excel · Data Analytics

Heritage Sales Analysis

Excel workbook that organizes heritage product sales data and analyzes it by Saudi city, store, product and sales channel.

  • Excel
Project details
Problem
Analyze traditional/heritage product sales performance across Saudi regions and cities.
Data
Sales and profit by city and store, product-level revenue, region, and sales channel.
Analysis
Total sales of 94,881,408.75 and total profit of 56,751,891.08, broken down by city, store, product, and channel.
Dashboard
Excel dashboard with region, city, and sales-channel filters plus a map visual.
Tools
Excel
My Role
Individual project — built end-to-end.
Key Insights
Clear variation in sales across regions, with top-performing cities and stores identifiable and a balanced channel split.
Outcome
Highlights sales differences across regions, cities, and stores, showing where performance is higher or lower.

AI & Data Projects

Certifications